Munk, A. K. (2021). Tracing culinary discourse on Facebook: A digital methods approach. In Research methods in digital food studies (pp. 201-219). Routledge.
@incollection{munk2021tracing,title={Tracing culinary discourse on Facebook: A digital methods approach},author={Munk, Anders Kristian},booktitle={Research methods in digital food studies}, pages={201--219}, year={2021}, publisher={Routledge}}
I wrote this text book chapter based on follow-on research from the Edible North project funded by the Carlsberg Foundation between 2012 and 2015. The project employed a combination of digital and ethnographic methods to map the diffusion of the New Nordic Food Phenomenon across issue contexts in Scandinavia and beyond. When Facebook announced sweeping changes its API policies in 2018, I took the opportunity to build global dataset of food pages investigate the way Nordic chefs were being cited.
The chapter is published in Research Methods in Digital Food Studies edited by Jonathan Leer and Stinne Gunder Strøm Krogager and shows how to map discursive patterns in online food talk.
It can be read as an introduction to digital methods like web scraping and visual network analysis in a food studies context. Or it could be read as a general introduction to those methods where online food talk is simply the example.
p.201
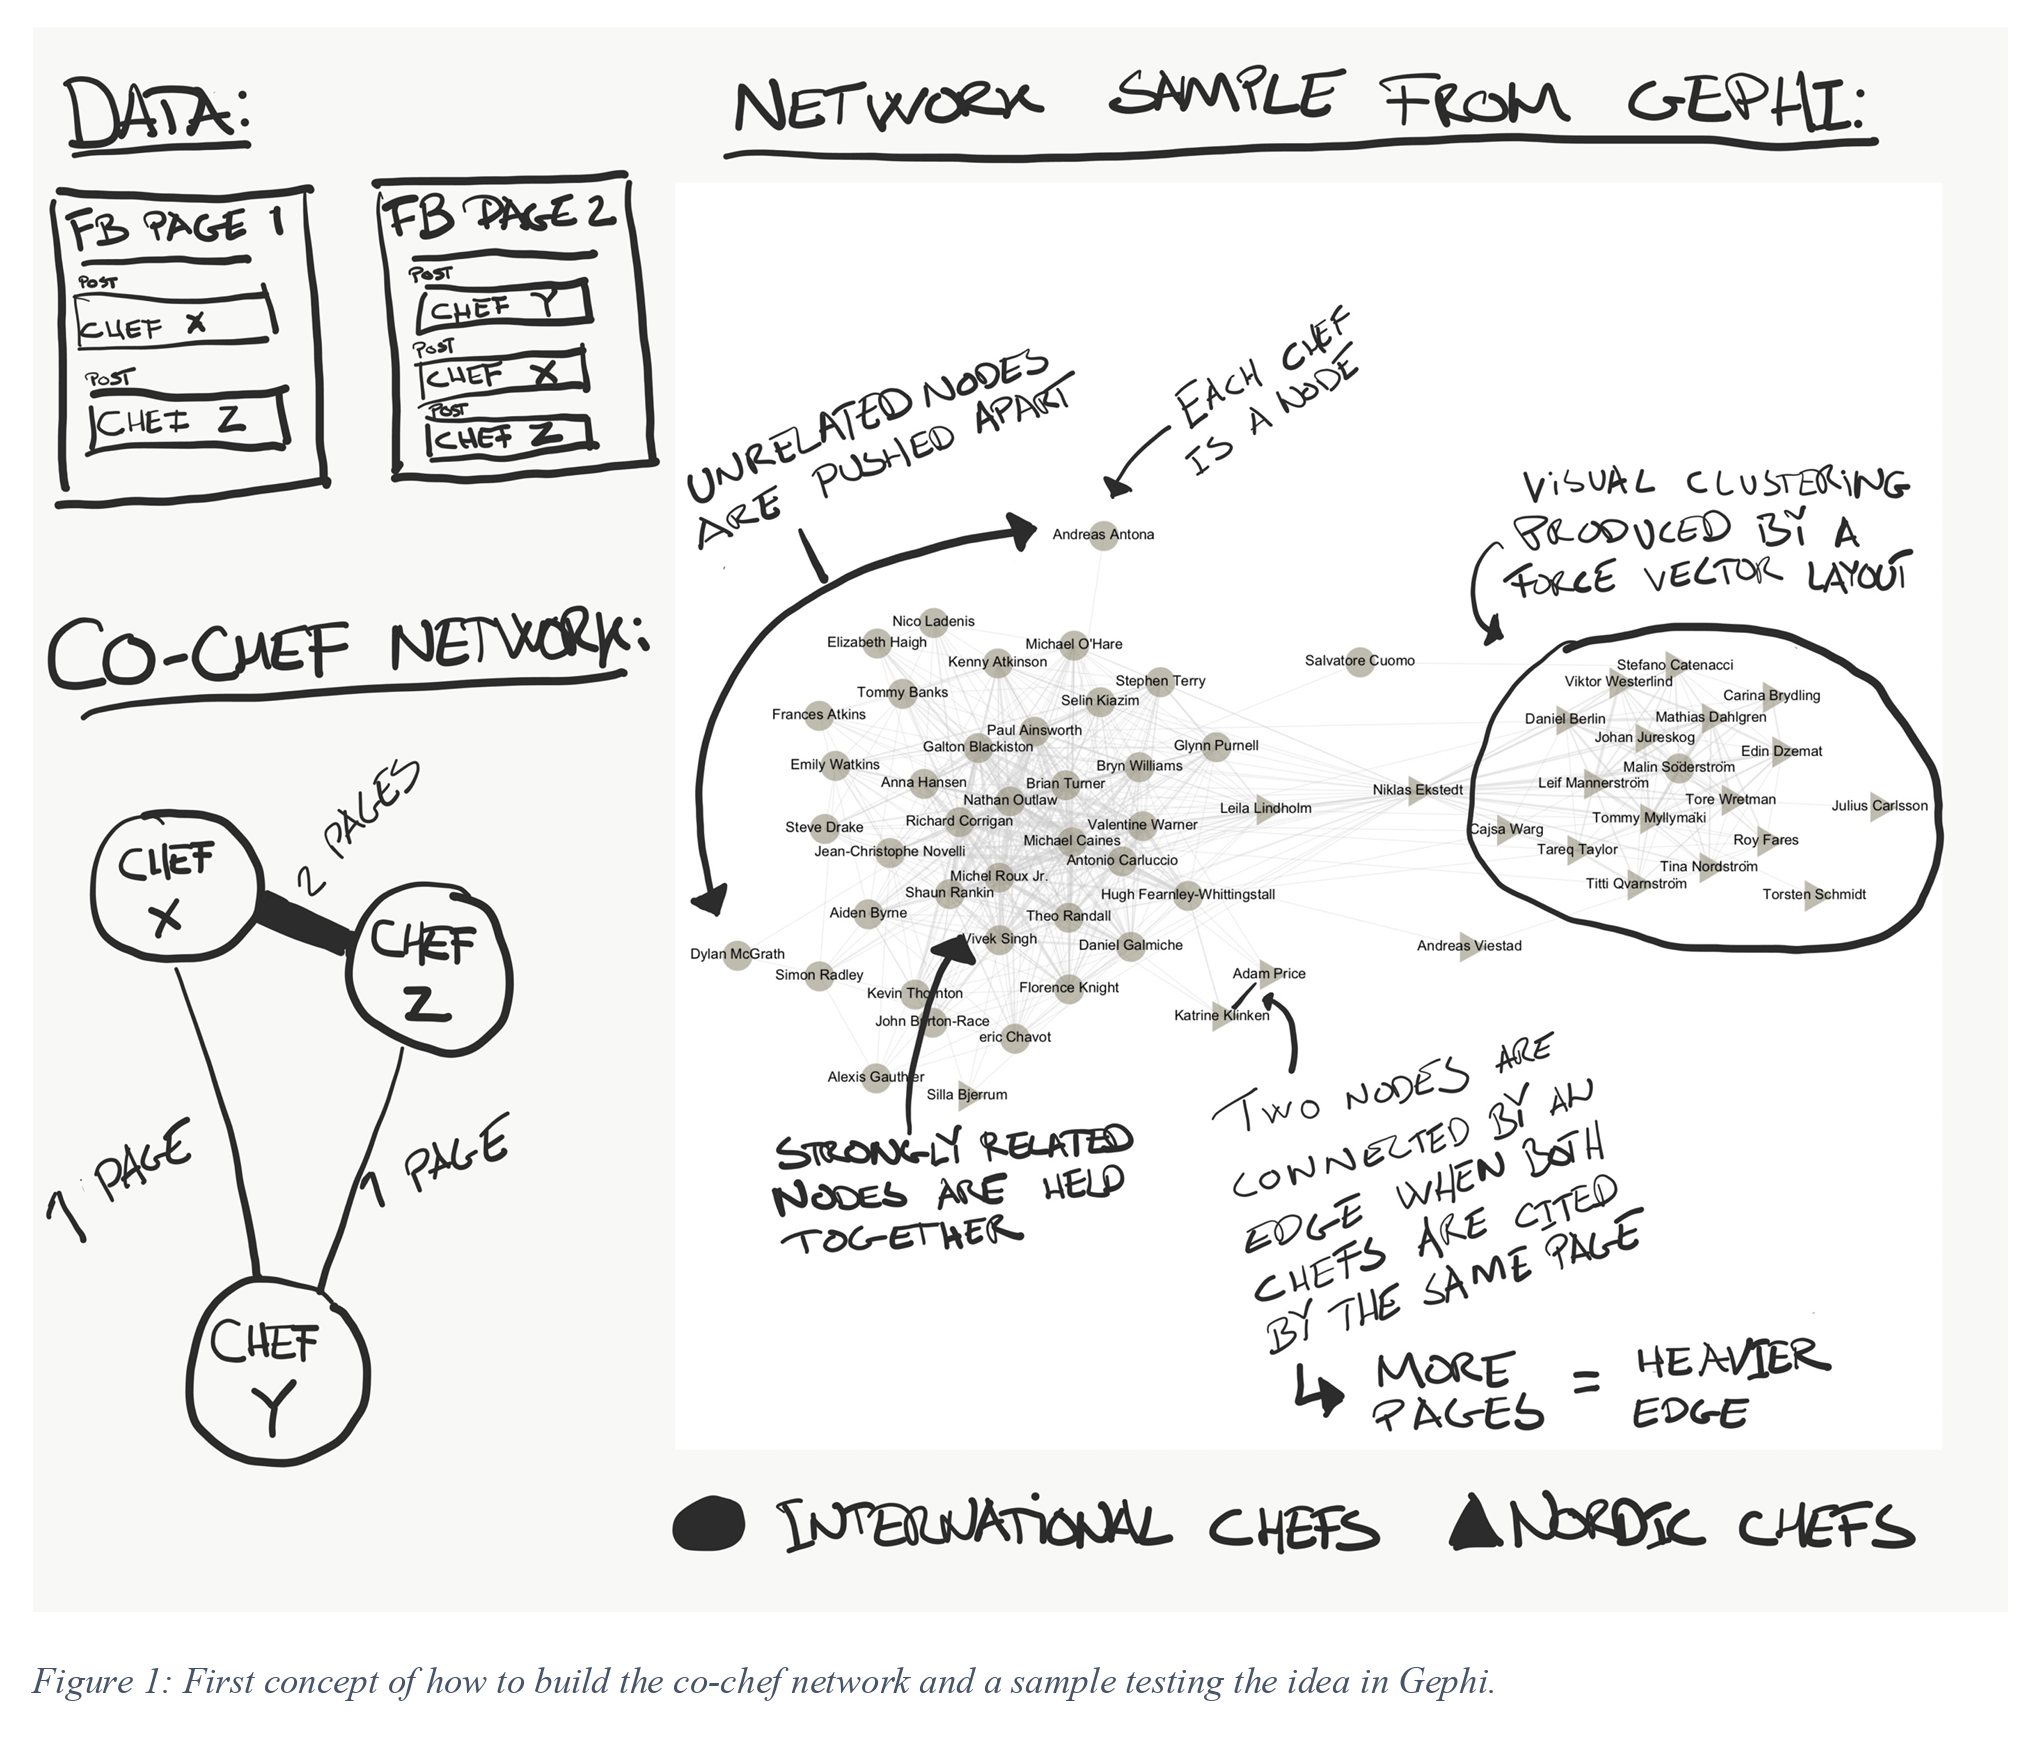
In a dataset of 102M posts collected from 242K food-related Facebook pages worldwide, I track mentions of almost 700 chefs. I construct a ‘co-chef’ network (a network of chefs connected to each other if they are mentioned by the same pages) which I subject to a visual network analysis. I provide the network file so that you can follow my steps but it is of course also possible to take a different direction on your own (for example based on a smaller dataset, differently curated, or from a different medium). I also provide a series of intermediary visualizations annotated with my field notes which will hopefully make my thought process clearer.
p.217
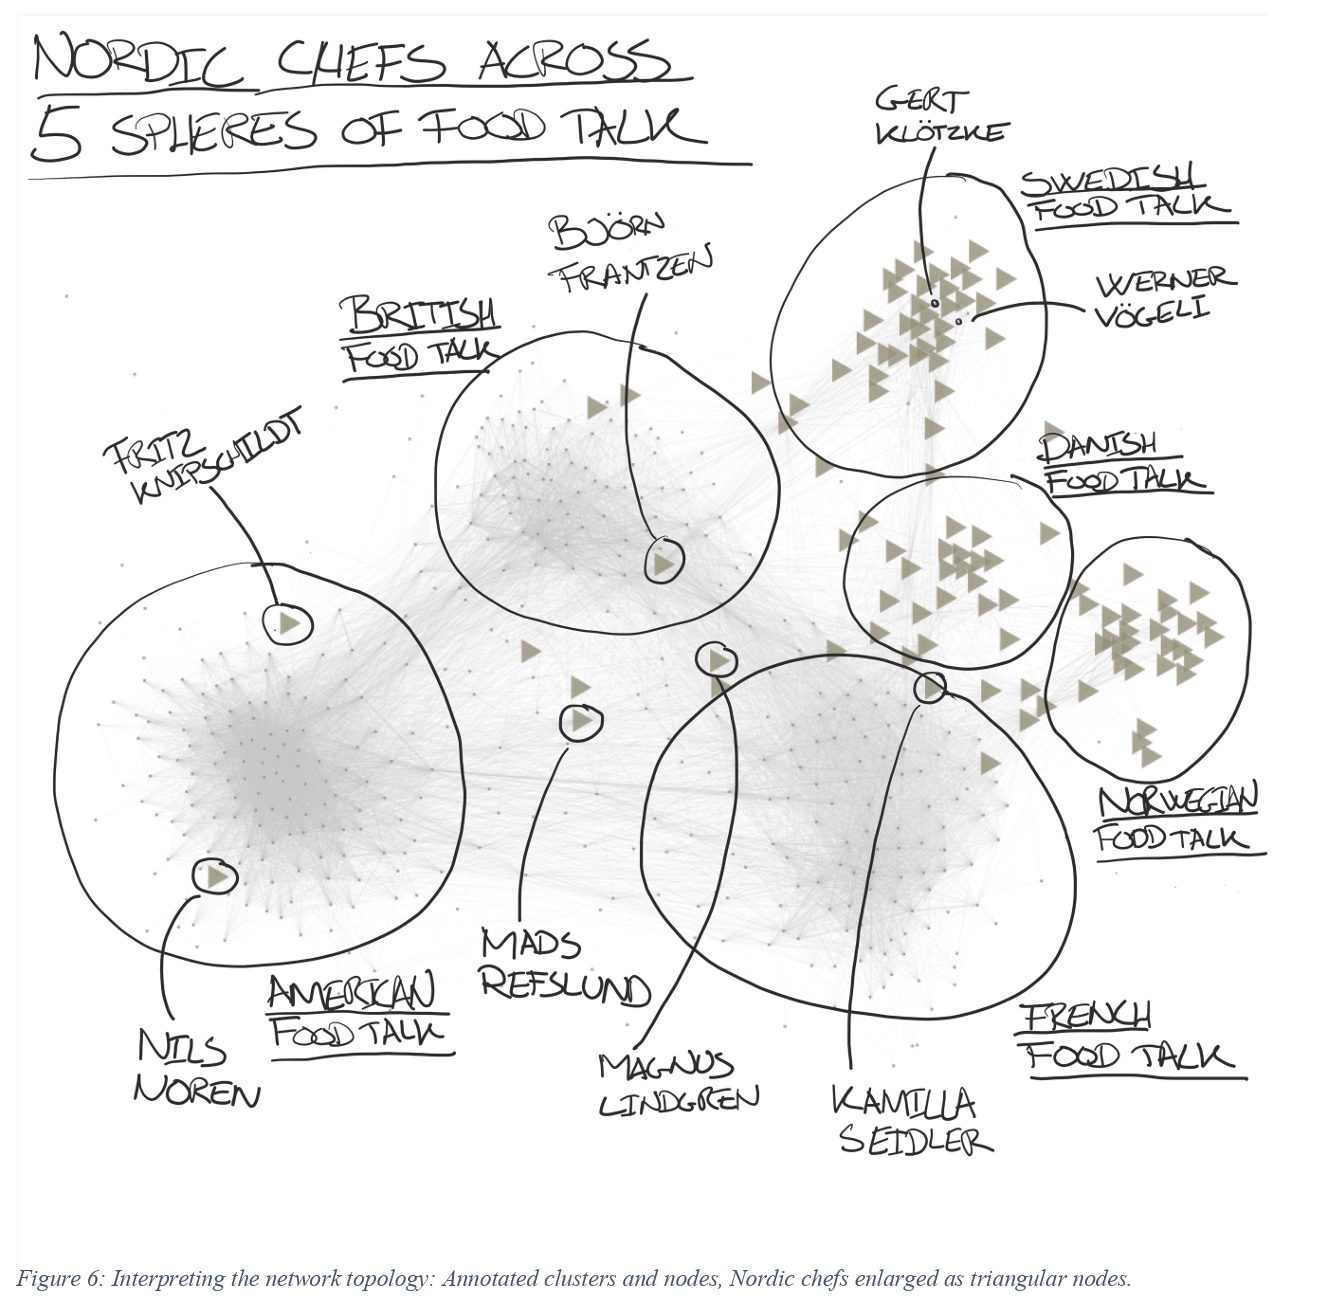
The strength of visual network analysis is that it does not presume any prior categories, except for the kind of relationality we choose to include as edges between the nodes. (…)This is a fundamentally explorative process that is useful for setting a direction for further qualitative work. It is not a way to confirm or refute a hypothesis with some degree of probability. We are using quantitative techniques to do qualitative ground work on volumes of messy data that would otherwise be impossible to handle.
In the chapter, I share a series of annotated intermediary visualization taken as notes during my own analytical process (samples below) and I share the example data that allows you to reproduce the results in Gephi or Gephi Lite.